Our Services
Quality Analysis
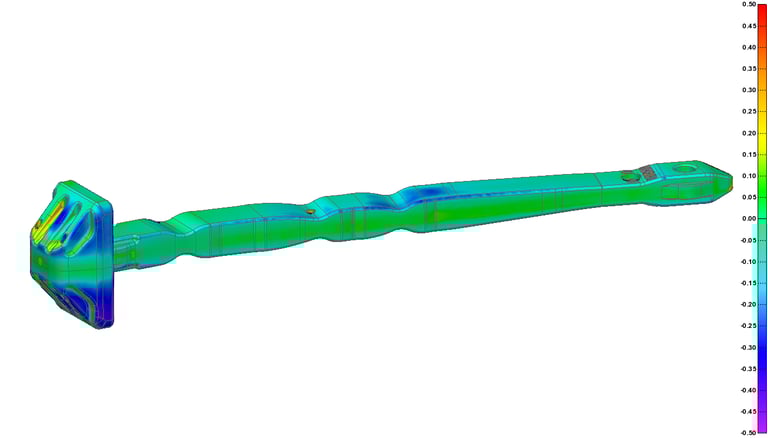
A color deviation map serves as a powerful diagnostic tool by providing an immediate, full-field visual comparison between a scanned production part and its original CAD model. Unlike traditional text-based inspection reports that only provide data for specific points, a color map utilizes a chromatic scale to highlight the magnitude and direction of surface variances across the entire geometry, with red typically indicating excess material (positive deviation) and blue indicating material deficits (negative deviation). This intuitive visualization allows engineers to quickly pinpoint complex manufacturing issues such as warping, sink marks, or tooling wear that might be missed by discrete measurements. By transforming thousands of data points into a clear "heat map" of accuracy, it streamlines first article inspections and root-cause analysis, enabling rapid decision-making to correct process errors and ensure the part meets strict tolerance specifications.


Reverse Engineering
Transforming physical components into precise digital models for redesign.
Contact
Reach out for precise 3D scanning solutions.
© 2025. All rights reserved.
PHONE
705-302-0209